

Factors of age, gender and nationality affect how many hours specialists work and how long they stay in the workforce.
There were 234 specialists registered in the vocation of obstetrics and gynaecology with the Medical Council of New Zealand (MCNZ) in 2011. Of these, 204 (87 per cent) contributed to the MCNZ workforce survey. This article is based on both the MCNZ data and the RANZCOG Practice Profile survey from 2012 (completed by 167 Fellows). International medical graduates (IMGs) make up 131 (56 per cent) of the New Zealand O and G specialist workforce. Some of these IMGs are members or Fellows of RANZCOG, the remainder are members or Fellows of their home colleges.
A survey of New Zealand District Health Boards (DHB) by our NZ committee executive officer revealed that there are currently 165 specialist O and G full-time equivalent (FTE) positions in New Zealand, with possibly another five FTE positions to be created by two DHBs. The difference between the number of specialists and the number of FTEs is accounted for by the 25 specialists in full-time private practice and the 110 specialists that do part-time private practice as well as some (numbers unknown) who choose to work part-time in the public system.
In New Zealand, 18–19 Integrated Training Program (ITP) Trainees have been appointed annually over the last two years to the 11 ITP rotations. The difference in numbers is accounted for by leave of various types, both temporary and permanent. Across Australia and New Zealand, 60 per cent of the ITP intake becomes Fellows annually, so we can expect to generate 11 new specialists per year or 55 new specialists every five years.
The age distribution of New Zealand O and G specialists from the 2005 and 2011 MCNZ workforce surveys is shown below (see Table 1 and Figure 3).
It can be seen that, within five years, six Fellows will be 75+, ten Fellows will be 70+, 23 Fellows will be 65+ and 39 Fellows will be 60+. The key questions are how many are going to retire and how many are going to reduce their hours and by how much?
We can get some insight from the Practice Profile, which states that 22 Fellows plan to cease private obstetrics during the next five years and 13 Fellows plan to cease public gynaecology within the next five years. It is likely, but not certain, more than 13 of the 39 Fellows aged 65 and over within the next five years will retire. If only 13 Fellows retired it would leave a depressing 42 of 55 new Fellows without employment.
There are, however, other factors that will see a greater number of Fellows required. The medical workforce is becoming feminised as well as ageing, and both female doctors and older doctors work fewer hours.
The MCNZ survey reveals, on average, in New Zealand, male doctors work 46 hours per week and female doctors work 39 hours per week. Currently, the majority of the medical workforce in New Zealand aged under 50 years is female and over 50 years is male. However, 73 per cent of our O and G Trainees and 41 per cent of our new Fellows in 2011 were female. Doctors in New Zealand work 40–43 hours a week until 65, when they reduce to an average of 36 hours. At 70 the average is further reduced to 28 hours per week. The other trend noted is doctors are working fewer hours. In 2001, the average New Zealand specialist worked 49 hours per week; in 2011 they worked 45 hours per week(MCNZ 2011).1
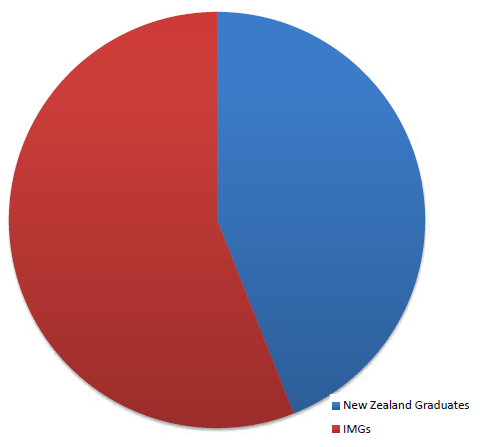
Figure 1. New Zealand O and G specialists by origin in 2011.
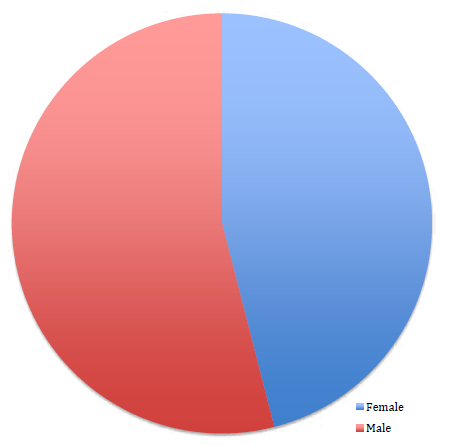
Figure 2. New Zealand O and G specialists by gender in 2011.
Table 1. Specialists: O and G as main work type by age group, 2005 and 2011.
| Age range |
<=24 No. % of total |
25–29 No. % of total |
30–34 No. % of total |
35–39% No. % of total |
40–44 No. % of total |
45–49 No. % of total |
50–54 No. % of total |
55–59 No. % of total |
60–64 No. % of total |
65–69 No. % of total |
70+ No. % of total |
Total No. % of total |
| 2005 | ||||||||||||
| O&G | 0 0% |
0 0% |
4 2.3% |
17 9.9% |
29 17% |
46 26.9% |
34 19.9% |
22 12.9% |
6 3.5% |
12 7% |
1 0.6% |
171 100% |
| All work types |
0 0% |
3 0.1% |
72 2.4% |
371 12.6% |
593 20.2% |
676 23% |
451 15.3% |
346 11.8% |
131 4.5% |
131 4.5% |
76 2.6% |
2940 100% |
| 2011 | ||||||||||||
| O&G | G 0 0% | 0 0% | 1 0.5% | 11 5.4% | 31 15.2% |
35 17.2% |
48 23.5% |
39 19.1% |
23 11.3% |
10 4.9% |
6 2.9% |
204 100% |
| Total | 0 0% | 7 0.2% | 68 1.6% | 516 12.3% |
758 18.1% |
736 17.6% |
810 19.3% |
547 13.1% |
367 8.8% |
249 5.9% |
129 3.1% |
4187 100% |
Source: NCNZ Annual Workforce Surveys; response rates were approximately 91 per cent (2011) and 85 per cent (2005).
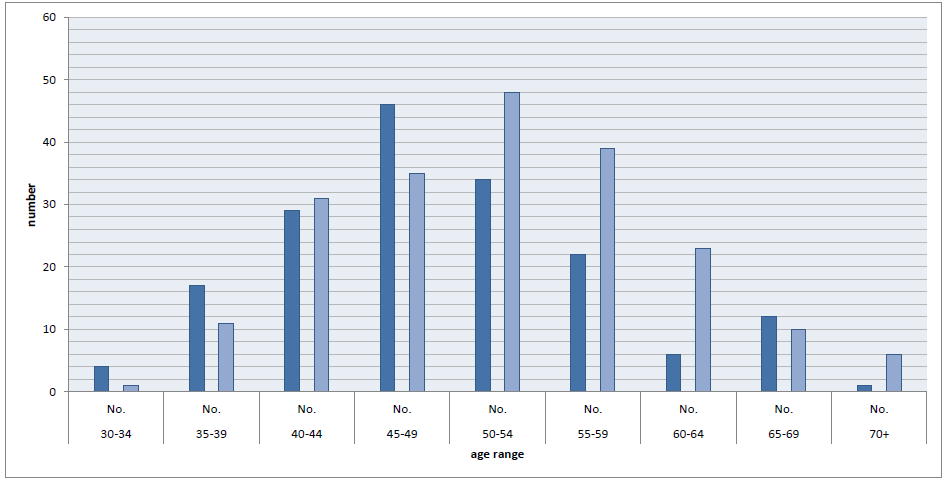
Figure 3. O and G specialists in New Zealand by age band 2005 dark, 2011 light.
Although the percentage of doctors in New Zealand working after the age of 60 is decreasing, as the total number of doctors is increasing, the number of doctors in the five-year age bands progressing through the years from 2005 to 2011 does not decrease until age 70. This suggests that most doctors retire at around 70 years of age. However, within our specialty, looking at the 65–69-year-old cohort of 12 specialists in 2005, we can see that only six specialists are still working as 70+ year olds in 2011.
Assuming 165 FTE x 40 hours equals 6600 hours of public specialist O and G work per week across New Zealand’s public hospitals, we can see the influence of these various trends on the requirement for new Fellows within the next five years:
- We can expect the six Fellows aged 75+ to retire = 6 FTEs.
- Assuming seven of the ten 70+ year olds will have retired and the remaining three will work an average of 28 hours per week. (7 x 40 hours + 3 x 12 hours)/40 = 7.9 FTEs
- Assuming half of the 23 65–69 year olds retire and the other half reduce their hours to 36 hours a week then (11.5 x 40 hours + 11.5 x 4 hours)/40 = 12.65 FTEs.
- Assuming average hours worked per doctor decrease byanother two hours over the next five years (165 x 2 hours)/40= 8.25 FTEs.
- Assuming the feminisation of the specialist workforce increases to 73 per cent from the current 41 per cent and that those specialists work on average six hours a week less than their male counterparts, then (165 x 0.73 – 165 x 0.41) x 6 hours = 312 hours/40 = 7.8 FTEs.
This combination of retirees and decrease in working hours gives a total of 42.6 FTE positions becoming available for the 55 new Fellows predicted.
However, before the Trainees become too despondent, the forgotten factor is that 56 per cent of the New Zealand specialist O and G workforce are IMGs. According to the 2011 MCNZ workforce survey, 25 per cent of vocationally registered IMGs leave the New Zealand register within five years of gaining vocational registration: 234 specialists x 0.56 x 0.25 = 32 FTEs.
This gives a total of 74.6 new FTEs being required over the next five years when we expect 55 Trainees to become Fellows. Clearly, then, there is still a need for IMGs.
In five to ten years’ time, there will be 39 specialists in the 65–69 age group and 48 specialists in the retirement age group.
The dynamics of specialist O and G immigration and emigration as well as per cent FTE or hours worked by individual specialists will need to be monitored. As the locally trained workforce increases then the FTE created by departing IMGs will diminish over time and thus fewer new FTE positions will be available.
In the future, we may need to employ some IMGs on the registrar roster as non-training registrars and limit ITP training posts and if we wish to balance workforce requirements with Trainee numbers.
References
- MCNZ workforce survey 2011 www.mcnz.org.nz/assets/News-and-Publications/Workforce-Surveys/2011.pdf.
- RANZCOG Practice Profile 2012 accessed through My RANZCOG.
Acknowledgement
Thanks to Robert Hipkiss at the Ministry of Health for extracting the specialist O and G workforce data from the 2005 and 2011 MCNZ workforce surveys.


Leave a Reply