

The aim of the partogram is to provide a pictorial overview of labour to alert midwives and obstetricians to deviations in the progress of labour as well as fetal and maternal well-being.
The partogram was thought to be one of the most important advances in modern obstetric care.1 Charts usually contain pre-printed alert and action lines. The alert line usually represents the slowest ten per cent of primigravid women’s progress in labour. A parallel action line is usually placed, a number of hours to the right of the alert line, to prompt effective management of slow progress of labour.
A number of authors2-4 have questioned the rate of progress expected in labour, suggesting that the current value of 1cm an hour in the active phase of labour is too quick and leads to unnecessary intervention. A more alarming trend by some obstetric care providers is to ignore the guidelines completely and to encourage women to labour in the face of what is a clearly obstructed labour. Ignoring guidelines that have been shown to reduce morbidity to both mother and baby is risky. Taking a snapshot and going with the moment and their maternal instincts is potentially exposing labouring women to serious complications, in particular, postpartum haemorrhage (PPH) and birth trauma. These women may ultimately reach full dilatation, but then have a very difficult delivery.
History
Friedman5 was the first obstetrician to graph the progress of labour. He studied 100 African primigravid patients in labour and recorded their progress in centimetres per hour. He produced a graph resembling a sigmoid curve. This became known as a cervicogram. The slowest ten per cent of women progressed at 1.2cm per hour.
Philpott6 was the first to realise the value of graphic records of labour. They are more efficient than lengthy written notes and the pictorial display provides a practical tool, recording all the intrapartum details, to immediately alert staff to abnormal developments. The partogram was first introduced into Harare Hospital in Rhodesia (now Zimbabwe) in 1972.
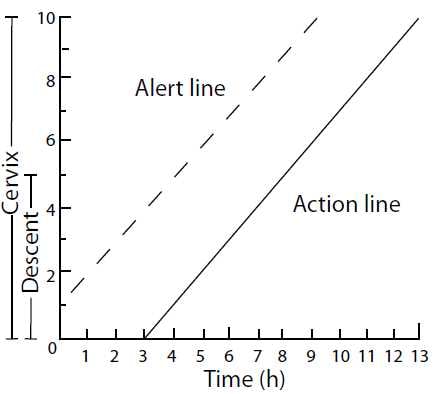
Figure 1a. Alert and action line on cervicograph. Graphic records in labour. Philpott R. British Medical Journal 4 (5833): 163-5, 1972.
The vast majority of the 30 000 patients under Philpott’s care delivered at midwife units peripheral to the main obstetric hospital. Working with extremely limited resources, in a hospital that dealt with 70 new obstetric fistulas a year, Philpott and his staff attempted to reduce obstetric morbidity (PPH, obstructed labours, ruptured uteruses).
In a study of African primigravid patients7, Philpott and Castle established that the slowest ten per cent of women dilated at 1cm per hour once they were in the active phase of labour (defined as being more than 3cm dilated). They drew an alert line representing dilatation of 1cm an hour once the patient reached 3cm of dilatation. In the initial publication the alert line started at 1cm of dilatation (see Figure 1a). This allows for different degrees of cervical effacement. In most other publications, the alert line starts at 3cm (see Figure 1b).
In a prospective study of 624 patients, Philpott and Castle8 trained midwifery staff in the peripheral units to do four-hourly cervical assessments. If the rate of progress of patients in the active phase crossed the alert line, they were transferred to the main hospital. A parallel action line was drawn four hours to the right of the alert line. Once in hospital, patients who crossed the alert line were examined after a further two hours. No intervention was required in those who had progressed satisfactorily. Those who crossed the action line were critically assessed to exclude obvious cephalo-pelvic disproportion (CPD). They were given an epidural block for analgesia, intravenous fluids and an oxytocin infusion if the contractions were thought to be inadequate. The fetus was carefully monitored. They were then allowed to labour for a further six hours provided adequate progress was being made in labour.
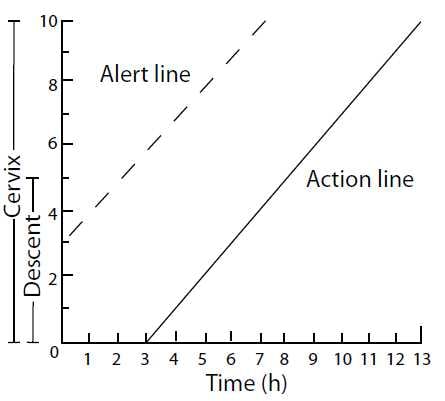
Figure 1b. Partogram with the alert line starting at 3cm.
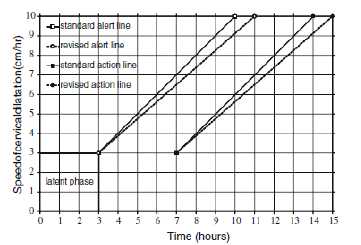
Figure 2. This shows the standard Philpott partogram and the revised one from Van Bogaert. Revising the primigravid partogram: does it make any difference? Archives of Gynecology and Obstetrics 279 (5): 643-7, 2009.
Seventy eight per cent of patients didn’t cross the alert line and 99 per cent of these had a vaginal delivery. Of the 22 per cent who crossed the alert line and were transferred to hospital, 11 per cent progressed satisfactorily and had a vaginal birth. Only 11 per cent of patients crossed the action line, of these: 28 per cent delivered spontaneously, 20.5 per cent required a ventouse delivery and 51.5 per cent a caesarean section. Simply triaging patients using a partogram had a huge impact on reducing the morbidity associated with childbirth in their community.
Current practice
Most obstetrical units today use a locally adapted form of partogram. The use of partograms to monitor labour is recommended by the World Health Organization.9 There is no doubt they are of great value in under-developed countries that don’t have sufficient well-trained obstetric care providers to allow early identification and transfer of patients who are likely to develop complications.
A Cochrane review10 concluded that there is insufficient evidence to recommend routine use of partograms as part of standard labour ward management. Finding a proper control group is very difficult. All of the randomised studies in the review use control groups whose care is provided by staff who have been trained to use the partogram. They are undoubtedly influenced by the fact that they know that the slowest tenth percentile of primigravida patients should progress at 1cm per hour in the active phase of labour. This will influence their management decisions.
Most studies quote the rate of dilatation in labour in the active phase used by Friedman5 of 1.2cm per hour rather than the rate used by Philpott and Castle of 1cm per hour.7 A number of authors have questioned whether these rates are too optimistic and lead to unnecessary interventions. A review by Neal et al2 of 18 studies in low-risk nulliparous patients found that the average linear rate of dilatation was 1.2cm per hour. The statistical limit (two standard deviations from the mean) was 0.6cm per hour.
Van Bogaert11 argued that the original study by Philpott was based on only 100 patients therefore the slowest ten per cent represented ten patients. He analysed the rate of progress of 1592 nulliparous patients in a South African district hospital and found that the slowest ten per cent progressed at 0.86cm per hour. The slowest ten per cent of those progressed at 0.63cm per hour, a figure similar to Neal’s statistical limit. By using a revised alert line, in his partogram (see Figure 2), he found that 72.5 per cent of patients stayed on the left of the alert line, compared to 56.1 per cent using the standard alert line on 1cm per hour.
A later study of 139812 multiparous women also examined two-hourly in labour found that the slowest ten per cent dilated at 1.7cm per hour.
Where to draw the line
There is also no consensus as to where the action line should be drawn. The original action line used by Philpott and Castle8 chose four hours as that was the maximum time it took to transport patients from the furthest midwifery birthing unit. The Cochrane review9 reviewed studies using an action line drawn after two, three or four hours. There are no consistent differences in outcomes. If it is drawn after two hours instead of four, it leads to more use of oxytocin, but the caesarean section remains unchanged. There were also no differences in the incidence of PPH.13 Pattinson et al14, in his study of 694 labouring nulliparous women in South Africa, found that women who received early intervention (two hours after no progress), had fewer caesarean deliveries (16 per cent) than those with expectant management (23.4 per cent, intervention after four hours without progress). That study was complicated as patients didn’t routinely have their membranes ruptured because of the high risk of HIV infection.
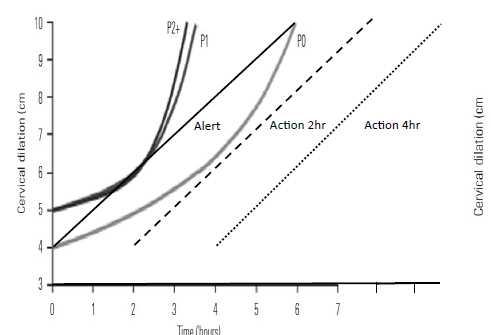
Figure 3. Average labour by parity in singleton pregnancies with spontaneous onset of labour, vaginal delivery and normal neonatal outcome. Abbreviations: PO, Nulliparous women; P1, women of parity 1; P2, women of parity 2+. Modified from Obstetric care consensus. Obstet Gynecol 2014; 123:693-711.
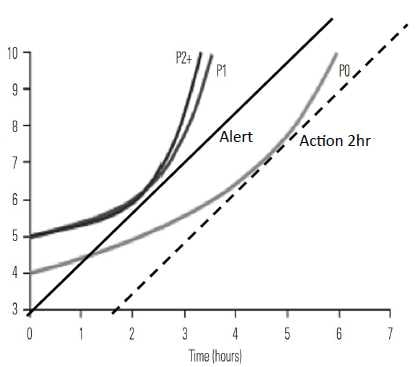
Figure 3a shows nulliparous women whose dilatation started at 4 cm. Figure 3b shows multiparous women whose dilatation started at 5cm.
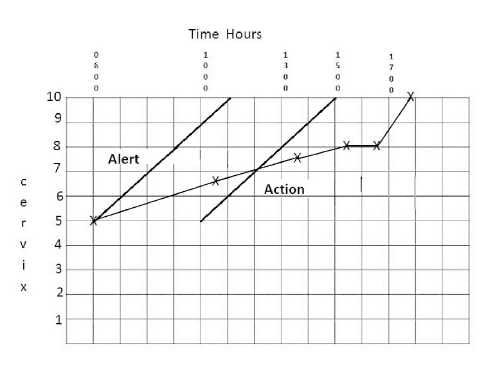
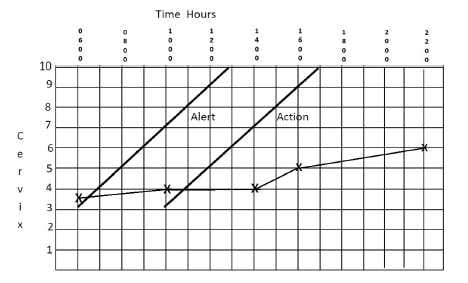
Figure 4a (top) and 4b (bottom). The partograms of two women who were allowed to labour on despite the lack of progress on their partograms.
When does the active phase of labour start?
There is some controversy as to when the active phase of labour starts. Most studies use 3cm as the start. The NICE guidelines15 recommend that the partogram be started once a woman reaches 4cm of dilatation. A recent obstetric care consensus developed by the American Congress of Obstetricians and Gynecologists and the Society for Maternal Fetal Medicine recommended that 6cm should be considered as the start of the active phase of labour. They used the data presented by Zhang et al16, which used statistical modelling to construct rates of progress in labour, and proposed a partogram based on these figures. The rates of progress in labour described by van Bogaert11,12 were obtained by examining each patient every two hours and calculating the mean and slowest tenth percentile of patients.
Figure 3 shows modified averaged labour curves by parity from Zang et al.16 These data were used in the Consensus Statement4 to support the argument that the active phase of labour should start at 6cm. It was suggested that using this figure would lead to less obstetrical intervention. Adding an alert line (calculated at 1cm per hour) and starting at 4cm (see Figure 3a) and a two and four hour action line to the data show that none of the nulliparous patients (P0) cross either of the action lines. In the multiparous groups P1 and P2+ (see Figure 3b) none of the patients crossed a two-hour action line so would not receive an intervention either.
Plotting alert and action lines on a partogram can alert obstetric caregivers to deviations from the expected rate of progress and allow them to pay more attention to those patients. Patients who progress to the left of an alert line are unlikely to develop an obstructed labour.
Perils of ignoring the partogram
Ignoring partograms completely as shown by the following examples is risky and resulted in potentially life-threatening situations. Both patients ultimately had caesarean sections. The patient in Figure 4a had a significant PPH. The baby born to the patient in 4b weighed 4.7kg and needed resuscitation at birth. Both these outcomes could have been avoided by heeding the partogram. There is no doubt that the proper use of partograms in under-developed countries has led to a significant reduction in maternal and fetal mortality and morbidity.
PPH may be another consequence of allowing labours to continue without regard to the partogram. PPH rates worldwide in developed countries have increased significantly over the last ten years.17-20 Most studies do not test to see if the length of the active phase of labour is a risk factor. Since 2010, at the Royal Hospital for Women, Randwick, some obstetric caregivers have ignored the standard rates of progress in labour as determined by the partogram alert and action lines and allowed patients to labour on (for example, Figures 4a and b). Coincidently, the incidence of blood transfusion associated with PPH for vaginal birth has increased threefold from 0.79 per cent to 2.16 per cent over one year.21 Transfusions in association with caesarean sections have also doubled, from 0.99 per cent to 2.09 per cent, over the same timeframe.21 This trend continued in 2011, and similar trends are occurring in a number of public hospitals in New South Wales. Further research is required to see if there is a link between the two events.
Until there is clear evidence that it is safe to ignore progress in labour, women should be examined every four hours in the active phase of labour. Data show that about ten per cent of patients will cross the alert line. Once this happens, they should be examined after a further two hours. If they have not made satisfactory progress, they should be examined by an experienced obstetrician. The aim is to exclude obvious cephalopelvic disproportion and to plan a management strategy to achieve an optimal outcome rather than be allowed to go with the instant and labour on and on.
References
- The partograph: preventing the dangers of a long labour. Safe Motherhood Newsletter. 1992.
- Neal JL, Lowe NK, Ahijevych KL, Patrick TE, Cabbage LA, Corwin EJ. “Active labor” duration and dilation rates among low-risk, nulliparous women with spontaneous labor onset: a systematic review. J Midwifery Womens Health. 2010;55(4):308-18.
- van Bogaert LJ. Revising the primigravid partogram: does it make any difference? Arch Gynecol Obstet. 2009;279(5):643-7.
- American Congress of Obstetricians and Gynecologists, Society for Maternal-Fetal Medicine. Obstetric care consensus no. 1: safe prevention of the primary cesarean delivery. Obstet Gynecol. 2014;123(3):693-711.
- Friedman E. The graphic analysis of labor. Am J Obstet Gynecol. 1954;68(6):1568-75.
- Philpott RH. Graphic records in labour. Br Med J. 1972; 4(5833):163-5.
- Philpott RH, Castle WM. Cervicographs in the management of labour in primigravidae. I. The alert line for detecting abnormal labour. J Obstet Gynaecol Br Commonw. 1972;79(7):592-8.
- Philpott RH, Castle WM. Cervicographs in the management of labour in primigravidae. II. The action line and treatment of abnormal labour. J Obstet Gynaecol Br Commonw. 1972;79(7):599-602.
- Souberbielle BE, O’Brien ME. Use of WHO partogram in developing countries. Lancet. 1994;344(8916):193.
- Lavender T, Hart A, Smyth RMD. Effect of partogram use on outcomes for women in spontaneous labour at term. The Cochrane database of systematic reviews. 2012;8:CD005461.
- van Bogaert LJ. The partogram. S Afr Med J. 2003;93(11):830-3.
- van Bogaert LJ. The multigravid partogram–should it be customised? (1).J Obstet Gynaecol. 2004;24(8):881-5
- Lavender T, Alfirevic Z, Walkinshaw S. Effect of different partogram action lines on birth outcomes: a randomized controlled trial. (1). Obstet Gynecol. 2006;108(2):295-302.
- Pattinson RC, Howarth GR, Mdluli W, Macdonald AP, Makin JD, Funk M. Aggressive or expectant management of labour: a randomised clinical trial. BJOG. 2003;110(5):457-61.
- National Institute for Health and Clinical Excellence. Intrapartum care: care of healthy women and their babies during childbirth. London: NICE, 2007. (http://guidance.nice.org.uk/CG055). National Institute for Health and Clinical Excellence. 2007.
- Zhang J, Landy HJ, Branch DW, Burkman R, Haberman S, Gregory KD et al. Contemporary patterns of spontaneous labor with normal neonatal outcomes. (1). Obstet Gynecol. 2010;116(6):1281-7.
- Kramer MS, Berg C, Abenhaim H, Dahhou M, Rouleau J, Mehrabadi A et al. Incidence, risk factors, and temporal trends in severe postpartum hemorrhage. Am J Obstet Gynecol. 2013;209(5):449.e1-7.
- Mehrabadi A, Hutcheon JA, Lee L, Kramer MS, Liston RM, Joseph KS. Epidemiological investigation of a temporal increase in atonic postpartum haemorrhage: a population-based retrospective cohort study. BJOG. 2013;120(7):853-62.
- Knight M, Callaghan WM, Berg C, Alexander S, Bouvier-Colle MH, Ford JB et al. Trends in postpartum hemorrhage in high resource countries: a review and recommendations from the International Postpartum Hemorrhage Collaborative Group. BMC Pregnancy Childbirth. 2009;9(1):55.
- Wetta LA, Szychowski JM, Seals S, Mancuso MS, Biggio JR, Tita ATN. Risk factors for uterine atony/postpartum hemorrhage requiring treatment after vaginal delivery. Am J Obstet Gynecol. 2013;209(1):51.e1-6.
- Centre for Epidemiology and Evidence. New South Wales Mothers and Babies 2010. Sydney: NSW Ministry of Health, 2012. Sydney: NSW Ministry of Health, 2012.


Leave a Reply