

The fetal ST interval changes if the fetus suffers oxygen deficiency. ST analysis, therefore, promises to highlight those changes and expedite delivery of the hypoxic fetus. Does it work?
Despite guidelines for the use and interpretation of cardiotocographic (CTG) traces in labour, outcomes in some units still do not match the wish to deliver all neonates unaffected by intrapartum asphyxia. Some guidelines, like those of the UK’s National Institute of Health and Care Excellence (NICE) 20071, are designed to annotate anomaly and appoint risk, while others use a likelihood scale for the risk of fetal acidaemia. All rely on a definitive diagnosis of acidaemia being provided by fetal scalp blood sampling, which is variably available in units owing to expertise and equipment issues. Since the advent of CTG monitoring in labour, various groups have attempted to improve on the fetal heart rate monitoring with the development of other technologies, one of which is analysis of the fetal electrocardiographic (FECG) waveform.
A chance tracing of the FECG was first made in 1906, when Cremer was recording the ECG of a pregnant woman using a very primitive string galvanometer.2 Over the next 50 years, many attempts were made to obtain a reliable and reproducible recording of the FECG, but all were thwarted by poor signal quality and electrical interference that obliterated all but some of the QRS complexes. Even the advent of the fetal scalp electrode failed to give a clear and usable signal, owing to the noise associated with the second electrode (see Figure 1). Some tried placing the second electrode in places like the vagina and even the rectum, but (fortunately) this did not improve the signal over that placed on the leg. Others tried electrical filters to deal with the unwanted interference, but they destroyed the recording of the low frequency P and T waves. Still others successfully used averaging of the signals in a technique, where the R waves of successive heart beats were aligned electronically to produce a single waveform on a computer screen every four, six or 15 beats. This resulted in the regular P and T waves of the complexes being visualised while the random electrical noise on the trace was diminished. The clarity of the waveform was improved by adding more and more complexes to an average, but herein lies an important problem. If the PR or ST intervals varied (see Figure 2), the P and T waves would not align exactly as each successive waveform was added to the average. Hence, for any given T wave height measured at a steady heart rate, the averaged waveform T wave height would fall in the recorded averaged complex if the heart rate rose or fell, given that the ST interval varies with heart rate, even though the actual T wave height did not change.
So, where does this leave the FECG waveform and, in particular, the measurement of the T wave? In 1987, Greene showed in the fetal sheep that ST segment and T wave elevation occurred during moderate and severe hypoxia.3 A microprocessor-based system was developed4 to measure these changes using averaging of the ECG waveform around the R waves. The ST waveform changes were measured as the ratio of the T wave height/the QRS complex height, called the T/QRS ratio.
Sheep data showed a rise in the T/QRS ratio occurred not only to fetal asphyxia, but also to an infusion of isoprenaline (an adrenaline analogue) in the normoxic fetus. The T wave changes in asphyxia were reported to be not due to the effects of adrenaline on the heart as the T wave remained elevated in the presence of propranolol a beta blocker.8 The T wave changes in fetal asphyxia are attributed to myocardial glycogenolysis and metabolic acidosis. If that is not confusing enough, a further T wave change was seen in ‘acute hypoxic stress’ where the T wave was seen to become biphasic and not increase in height.6
In the face of the understanding that T wave changes in the fetus can occur in the normoxic and hypoxic fetus and those changes are not uniform depending on the acute nature of any fetal hypoxia, the advent of a commercial ST microprocessor (STAN, Neoventa Medical AB) still led to the development of randomised clinical trials in humans. The trials were to look at the CTG + T/QRS versus CTG +/- fetal blood loss sampling (FBS) alone with the outcomes being caesarean section rates, operative vaginal delivery rates, cord metabolic acidosis, neonatal encephalopathy, admissions to special care unit and the need for fetal scalp blood sampling. In the early phase of the human studies, one trial was investigated for the accusation of scientific fraud by Lund University, Sweden (see Figure 3).
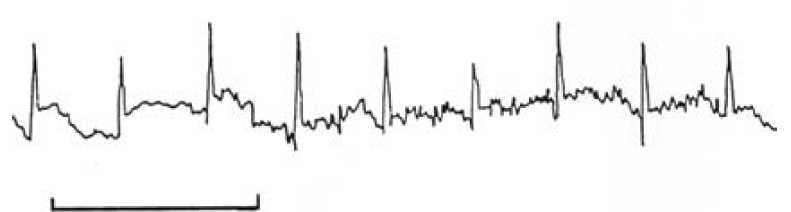
Figure 1. A typical ECG signal obtained from a fetal scalp electrode. The bar equals one second.
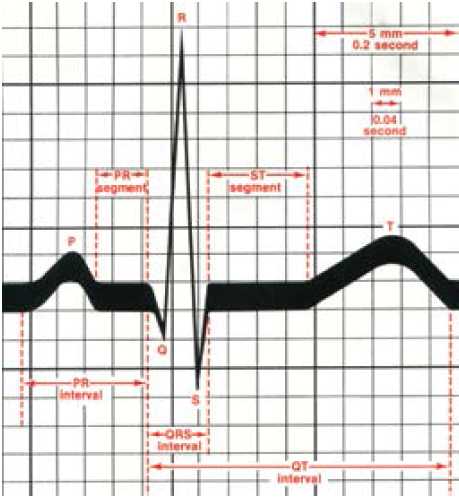
Figure 2. The ECG waveform.11
The parameters for recording the T/QRS are strict:
- Given that a T wave rise can occur in the face of fetal stress or hypoxia and that the normal baseline height varies from fetus to fetus, recording of the T wave in any labour has to begin before any rise in T wave has occurred in order for it to be appreciated. This means the membranes have to be ruptured and the scalp electrode applied in early labour, and preferably before any CTG anomaly has occurred.
- Given that the T wave can respond to innate fetal adrenaline, which can vary even in normoxia, any T/QRS change has
to be related to the fetal condition as defined by the CTG. The CTG classification used for the clinical trials is the FIGO classification, which differs from both the NICE and RANZCOG classifications. No T/QRS change is considered significant in the face of a normal CTG – which presupposes the CTG can be correctly interpreted. - Recordings can only be made if the fetus is ≥36.0 weeks gestation given ‘preterm fetuses may have underdeveloped endocardial-epicardial inter-phase that may interfere with signal conduction’9, a statement for which it is difficult to find extensive evidence.
- Recording cannot occur in a fetus ‘with structural or functional cardiac anomaly’.
- Recording necessitates membrane rupture and application of a scalp electrode, eliminating those in whom an electrode is contraindicated.
- Recordings should not be ceased (even if the CTG is normal) in order not to miss a T/QRS change.
- If the fetal signal is poor and the T/QRS cannot be recorded, the CTG analysis should revert to that of the NICE guideline.
Once applied, the recording of the T/QRS ratio requires a number of algorithms to be followed. The first is the four Cs: check that case is appropriate; classify the CTG (the main issue that dogs the use of the CTG and why we wanted a different technology in the first place); correlate the observed T wave changes with the CTG to determine any significance; and cascade for timely and appropriate intervention.9 The algorithm for management of a T/QRS change is given in Figure 4.
Clinical experience has led to some revision of the guidance.9 Of particular concern is: ‘Abnormal CTG pattern for more than 60 minutes, or less if the FHR deteriorates rapidly, with normal ST requires qualified assessment and checking for non-deteriorating fetal state’. I think this means: if the CTG is abnormal but the T wave has not risen, check according to the CTG not the T wave. Why might the T wave not rise in fetal compromise? Possibly the decelerations are lowering the recorded T wave height owing to the averaging issue mentioned earlier, possibly some fetuses function at a maximal adrenergic drive and the T wave does not change with increasing hypoxia.7 So that may explain the acknowledged five per cent false negative rate of T/QRS detection of fetal hypoxia. Why might there also be an acknowledged five per cent false positive rate? A fetus with typical variable decelerations and a normal pH can raise adrenaline as a response to the cord compression.7
The revision also indicates that intervention in response to the T/QRS changes indicating asphyxia should be in the form of delivery within 20 minutes in first stage and ten minutes in second stage, a limiting feature in many units.
So much for the limitations. What were the Cochrane metanalysis10 outcomes for the trials of CTG+ T/QRS versus CTG +/- FBS alone in labour? Five trials with 15 338 women show no significant difference in the:
- LUSCS rate, (RR 0.99, 95 per cent, CI 0.91-1.08);
- rate of neonatal metabolic acidaemia (RR 0.78, 95 per cent,
CI 0.44-1.37); and - neonatal encephalopathy (RR 0.54, 95 per cent, CI 0.24-
1.25).

Figure 3. Press release from Lund University suggesting scientific fraud.
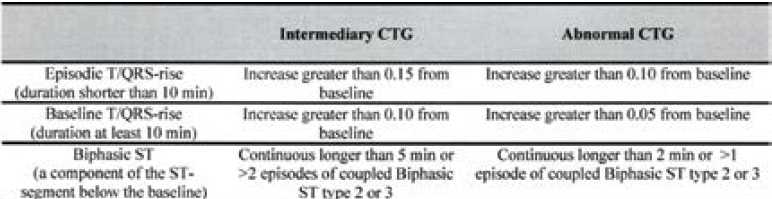
Figure 4. STAN clinical guidelines: ST-changes that prompt clinical intervention.6
Of significance was:
- fewer blood scalp samples in labour (RR 0.61, 95 per cent, CI
0.41-0.91); - fewer operative vaginal deliveries (RR 0.89, 95 per cent, CI
0.81-0.98); and - fewer admissions to SCBU (RR 0.89, 95 per cent, CI 0.81-
0.99).
Unfortunately, the ST waveform does not fulfil the wish to have a technique that results in the reliable detection of intrapartum asphyxia over that of the CTG. Further data for the meta-analysis will, I am sure, be welcome, but the requirements of the technique, including membrane rupture and FSE application, and the five per cent false positive and negative results, are a step too far for many to want to participate. Given that at least one unit in Australia achieves a rate of neonatal encephalopathy of less than 1/3000 in monitored labours using the NICE assessment criteria, reasons to move to another technology would need to be compelling.
References
- NICE 2007. Intrapartum Care Guideline GC55 Sept 2007. www.nice.org.uk.
- Cremer M, 1906. Ueber die direkte Ableitung der Aktionsstrome des menschlichen Herzens vom oesophagus und doer das electrokardiogram des gotus. Munchen med. Wchnschr., 553; 811-813.
- Greene K, 1987. The ECG waveform. In Whittle M editor. Ballierres Clinical Obstetrics and Gynaecology. Vol 1, London: Bailliere Tindall, 1987:131-55.
- Rosen KG, Lindecrantz K. STAN – the Gothenburg model for fetal surveillance during labour by ST analysis of the fetal ECG. Clinical Physics and Physiological Measurements 1989; 10(Suppl B): 51-56.
- Amer-Wahlin I, Arulkumaran S, Hagberg H, Marsal K, Visser GHA 2007. Fetal electrocardiogram:ST waveform analysis in intrapatum surveillance. BJOG 114, 1191-1193.
- Westenhuis MEMH, Moons KGM, van Beek E, Bijvoet SM, Drogtrop AP, van Geign HP, van Lith JMM, Mol BWJ, Nijhuis JG, Oei SG, Porath MM, Rijnders RJP, Schuitemaker NEW, van der Tweel I, Visser GHA, Willekes C, Kwee A 2007.
- A randomised clinical trial on cardiotocography plus fetal blood sampling versus cardiotocography plus ST-analysis of the fetal electrocardiogram (STAN®) for intrapartum monitoring. BMC Pregnancy and Childbirth 2007, 7:13. Murray HG.1992. The fetal electrocardiogram. DM thesis University of Nottingham.
- Hokegard KH, Karlsson K, Kjellmer I, Rosen KG, 1979. Acta Physiol Scand, 105: 195-203.
- Chandraharan 2010. STAN: An introduction to its use, limitations and caveats. www.neoventa.com .
- Neilson JP. Fetal electrocardiogram (ECG) for fetal monitoring during labour (Review). Cochrane Database of Systemic Reviews 2013, Issue 5. Art No CD000116. DOI: 10.1002/13651858.CD000116.pub4.
- Netter, FH. Basic Electrocardiography: ECG. 1986. CIBA-GEIGY Pharmaceuticals, West Caldwell, NJ.


Leave a Reply