

It is common to read in the lay press that there is an ‘epidemic’ of caesarean sections (CS), or that there is an ever-rising ‘tide’ of caesarean births in the learned journals.1 These terms sound very worrying, and maternity carers are commonly asked about this. To make things worse, we are told the World Health Organization (WHO) recommends that the maximum rate of caesarean birth should be no more than about 15 per cent. Why is this happening? Is the news all bad? Who is to blame for this ‘disaster’?
The rate of caesarean birth in Australia has certainly increased: in 1993, 19 per cent of all births were caesarean.2 Twenty years later, in 2013, that rate had increased to almost 33 per cent.3 At first glance this seems to be a big change, but lots of things have changed since then. For example, the median house price in Sydney was $188 000 in 1993, and mortgage interest rates were close to 10 per cent. By 2013, the median house price in Sydney was $625 000. Look at interest rates now!
Over the last decade, the rate of CS appears to have reached a plateau (Figure 1). Indeed, between 2012 and 2013 the CS rate increased by only 0.13 per cent (from 32.35% to 32.77%), or an additional 392 caesareans across the whole country.4 The only age groups in which there was a significant increase in the CS rate were teenaged mothers (comprising just slightly more than 10 000 births across the country) and women aged 24–29 years of age. In all other age bands, there was no statistically significant change in CS rates (Table 1). These are not the typical changes seen in an epidemic.
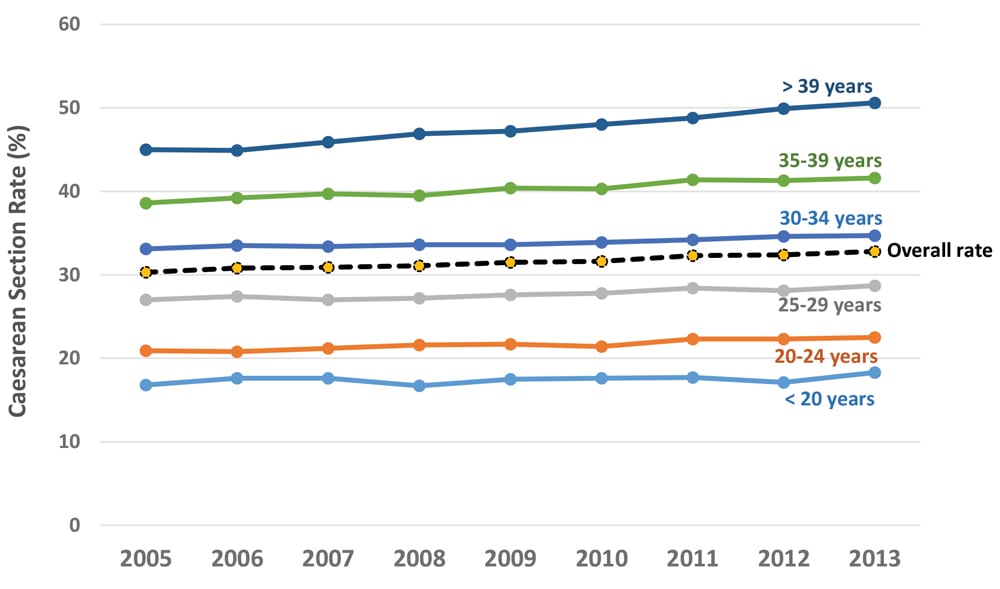
Figure 1. Rates of caesarean section by age band in Australia, 2005–13. From the AIHW Australia’s Mothers and Babies series.
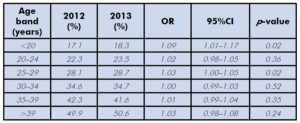
Table 1. Comparison of rates of caesarean section by age band in Australia, 2012 and 2013. Data from the AIHW Australia’s Mothers and Babies series.3
Caesarean birth is obviously more common than it was 20 years ago, but increases in the rate appear to have stabilised. For some people, the question now is almost the reverse: why aren’t rates of CS continuing to increase? And why did the WHO ever recommend a maximum rate of CS in the first place?
Since 1993, there have been major changes in the demography of women having babies. Twenty years ago the number of obese women who delivered was so low, in general, that statistics were rarely kept. Today, fewer than half of women who deliver are within the normal healthy weight range. About one-quarter are overweight, and almost one-in-five new mothers are obese.5 This change is important, because women who are obese are much more likely to have a caesarean delivery.6 Since the rate of obesity in reproductive-age women continues to increase, it seems remarkable that the CS rate appears to have plateaued.
Another change has been the age distribution of women having babies, particularly their first babies. Twenty years ago, births to women aged 35 years or more were uncommon – only 11.7 per cent were to women in this age group, with only 1.6 per cent of births to women aged 40 years or older.7 The proportion of older women has doubled, with 22.3 per cent of women now aged 35 years, and the proportion of women aged 40 years or more has almost tripled to 4.4 per cent.8 Maternal age is strongly associated with caesarean birth,9 so a major shift in the age demographics of women having babies will be another contributor.
One of the important issues to consider when counselling women about caesarean birth is the effect of multiple CS. Risks of severe potential pathologies, such as placenta accreta, begin to mount from the third CS onwards. Women who plan for large families should avoid CS if safely possible. Yet such families are now a rarity and parity has fallen dramatically. In Australia at present, only 20 per cent of women have three or more children and women having four or more children now constitute a mere 3.4 per cent of all births.10
Both obstetricians and women now seem less inclined to take risks with birth, and new information has emerged. Attempts at vaginal breech delivery have lost much of their allure with new safety concerns,11 and there is evolving evidence that adventurous attempts at vaginal birth are not necessarily good for women in the long term.12 The medicolegal environment has changed as well, with ever-greater consideration of the potential for adverse outcomes of vaginal birth.13 Studies from Australia14 and overseas15 confirm that one of the most common indications for CS is having had a previous CS. Women whose first child is delivered by CS are likely to have all subsequent children by repeat CS.16 On the other hand, for Australian women whose first birth is vaginal, all subsequent children are likely to be delivered vaginally.17
So where did the original WHO recommendation for a maximum CS rate of 15 per cent come from in the first place? It resulted from data suggesting that a number of countries with low perinatal mortality rates had low rates of CS.18 More recent and detailed analysis has shown this assumption to be flawed, with a value closer to 20 per cent as a more reliable figure.119However, taking very blunt endpoints, such as neonatal mortality, as the basis of a recommendation for target CS rates is a very narrow way to make this call. Prof Caroline de Costa and I have recently argued elsewhere that other endpoints such as prolapse and incontinence in later life are equally valid and are not taken into account in the WHO recommendation.20
Ultimately, attempts to reduce the rate of caesarean birth have been spectacularly unsuccessful, both in Australia and overseas.21 It seems that despite continuing changes in the demographics of women having children in Australia – increases in age and weight – the rate of caesarean birth has stabilised. Preventing a woman’s first caesarean birth is probably the key to reversing the rates in the long term, but doing this safely is very difficult to do. One thing that is certain is that nobody should be blithely referring to the WHO recommendation anymore; except as an interesting piece of history.
References
- Roberts CL, Nippita TA. International caesarean section rates: the rising tide. Lancet Glob Health. 2015;3:e241-2. doi: 10.1016/S2214-109X(15)70111-7.
- Lancaster P, Huang J, Lin M. 1996. Australia’s Mothers and Babies 1993. AIHW National Perinatal Statistics Unit. Perinatal Statistics Series Number 3. Sydney.
- AIHW 2015. Australia’s mothers and babies 2013–in brief. Perinatal statistics series no. 31. Cat. no. PER 72. Canberra: AIHW.
- AIHW 2015. Australia’s mothers and babies 2013–in brief. Perinatal statistics series no. 31. Cat. no. PER 72. Canberra: AIHW.
- AIHW 2015. Australia’s mothers and babies 2013–in brief. Perinatal statistics series no. 31. Cat. no. PER 72. Canberra: AIHW.
- Knight-Agarwal CR, Williams LT, Davis D, et al. Association of BMI and interpregnancy BMI change with birth outcomes in an Australian obstetric population: a retrospective cohort study. BMJ Open. 2016;6(5):e010667. doi: 10.1136/bmjopen-2015-010667.
- Lancaster P, Huang J, Lin M. 1996. Australia’s Mothers and Babies 1993. AIHW National Perinatal Statistics Unit. Perinatal Statistics Series Number 3. Sydney.
- AIHW 2015. Australia’s mothers and babies 2013–in brief. Perinatal statistics series no. 31. Cat. no. PER 72. Canberra: AIHW.
- Baghurst P, Robson S, Antoniou G, et al. The association between increasing maternal age at first birth and decreased rates of spontaneous vaginal birth in South Australia from 1991 to 2009. ANZJOG. 2014;54(3):237-43.
- AIHW 2015. Australia’s mothers and babies 2013–in brief. Perinatal statistics series no. 31. Cat. no. PER 72. Canberra: AIHW.
- Bin YS, Roberts CL, Ford JB, Nicholl MC. Outcomes of breech birth by mode of delivery: a population linkage study. ANZJOG. 2016;56(5):453-459. doi: 10.1111/ajo.12488.
- Dietz HP, Campbell S. Toward normal birth – but at what cost? Am J Obstet Gynecol. 2016;215(4):439-44. doi: 10.1016/j.ajog.2016.04.021.
- Lee A. ‘Bolam’ to ‘Montgomery’ is result of evolutionary change of medical practice towards ‘patient-centred care.’ Postgrad Med J. 2016. pii: postgradmedj-2016-134236. doi: 10.1136/postgradmedj-2016-134236.
- Howell S, Johnston T, Macleod SL. Trends and determinants of caesarean section births in Queensland, 1997-2006. ANZJOG. 2009;49(6):606-11.
- Vogel JP, Betran AP, Vindevoghel N, et al. Use of the Robson classification to assess caesarean section trends in 21 countries: a secondary analysis of two WHO multicountry surveys. Lancet Glob Health. 2015;3(5):e260-70. doi: 10.1016/S2214-109X(15)70094-X.
- Roberts CL, Algert CS, Ford JB, et al. Pathways to a rising caesarean section rate: a population-based cohort study. BMJ Open. 2012; 2:pii:e001725.
- Roberts CL, Algert CS, Todd AL, Morris JM. Reducing caesarean section rates – no easy task. ANZJOG. 2013;53:310-313.
- World Health Organization. Appropriate technology for birth. Lancet. 1985; 2(8452): 436-437.
- Molina G, Weiser TG, Lipsitz SR, et al. Relationship between cesarean delivery rate and maternal and neonatal mortality. JAMA. 2015;314:2263-2270.
- Robson S, de Costa C. Happy birthday! The WHO-recommended caesarean section rate turns 30. Med J Aust. In press.
- Khunpradit S, Tavender E, Lumbiganon P, et al. Non-clinical interventions for reducing unnecessary caesarean section. Cochrane Database Syst Rev. 2011;15:CD005528.


Leave a Reply