

In the demographic sense, a woman’s fertility is the number of live births that she has across her reproductive life cycle. Lifetime fertility is measured by demographers using the completed cohort fertility rate (CCFR). This is the average number of births that a group of women all born in the same year (a cohort) have over their lifetime. Thus, CCFR is based on the experience of a group of women across 35 calendar years as they age together from 15 to 50 years. In Australia, CCFR reached a peak of 3.14 births per woman for women born around 1933 but has fallen continuously for every subsequent birth cohort reaching 2.05 births per woman for women born in 1969. At this level, women born in 1969 replaced themselves exactly. Data for women born from 1970 onwards indicate that CCFR will continue its long-term historical decline.
For most policy purposes, however, the interest is not the number of births that women have over 35 calendar years but the total number of births that occur in each successive calendar year. In each calendar year, births occur to women of different ages. To measure the annual trend in fertility, demographers define a second measure, the total fertility rate (TFR), which is the sum from age 15 to age 49 of the fertility rates at each age in a particular year. This measure is analogous to CCFR except that it is based on the experience of women at different ages in the same calendar year.
Australia’s TFR (Figure 1) fell slowly throughout the 1990s to a low point in 2001–02 of 1.75 births per woman. Partly in response to the falling fertility rate, in the 2004–05 budget year, the Howard Government simultaneously introduced the Baby Bonus, the Child Care Rebate (CCR) and substantially increased the payments made to families for each of their children (formerly Family Allowance, now Family Tax Benefit Part A (FTB Part A). After the introduction of this policy package, fertility rates rose sharply at every age. In summary form, this is shown in Figure 1 with the TFR rising from 1.81 in 2004–05 to 2.00 in 2007–08. At 2.00 births per woman in 2007–08, TFR was at its highest level for 30 years.
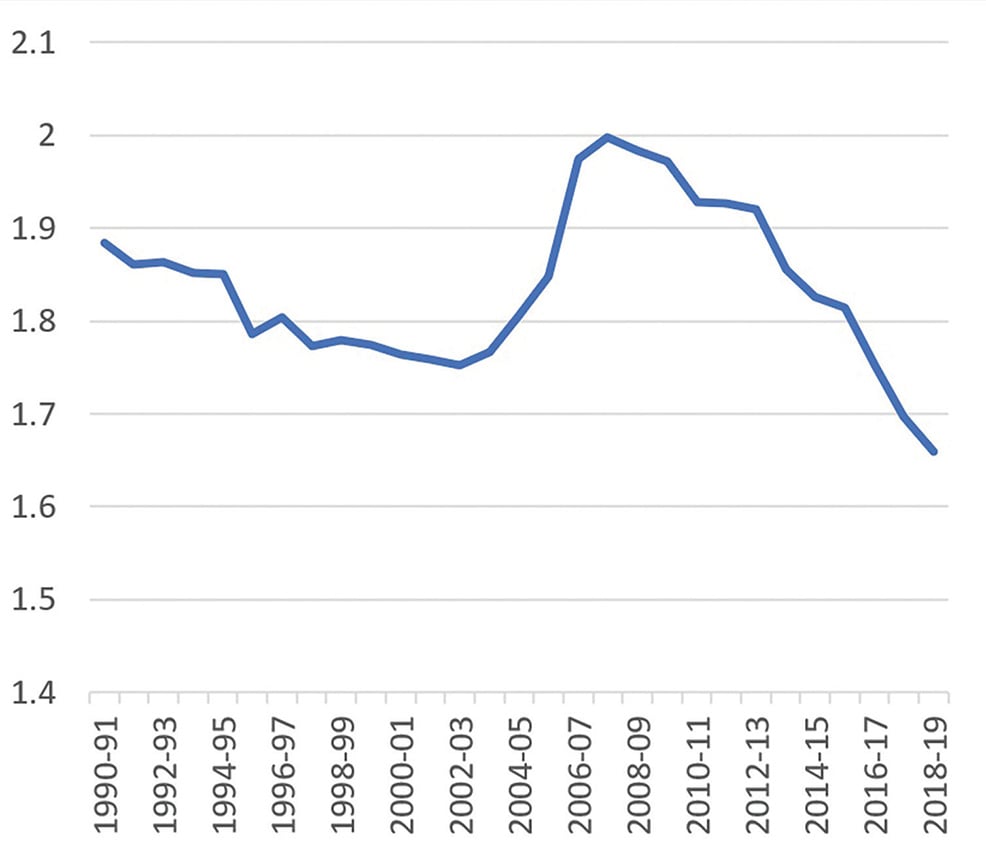
Figure 1. Total Fertility Rate, Australia, 1990–91 to 2018–19.
Given the speed and size of this rise and that it applied to women of all ages, it is hard to argue that the policy package did not have an effect. While it is very likely that TFR would have risen at this time without the policy package because educated women in their 30s began to have the births that they had previously delayed at younger ages, this does not explain the rise in fertility at younger ages. And it may well be that the policy package, particularly the CCR, encouraged older educated women to have the babies that they had delayed or at least to have them earlier than otherwise would have been the case.
The TFR remained historically high to 2012–13 in which year it was 1.92 births per woman, but a sharp downward movement has occurred since then to a rate of 1.66 in 2018–19, the last year for which statistics are available. The Commonwealth Treasury expects that COVID-19 will lead to even lower fertility in the short term as births are delayed due to increased economic uncertainty. At 1.66 births per woman, TFR is at its lowest level in Australian history. So, in just a decade, Australian fertility fell from its highest level for 30 years to its lowest level ever. What happened?
Based on long historical experience, when TFR moves by a large amount in a short period of time, either up or down, the movement is associated with changes in the timing of births, particularly the age at which women have their first birth. When women shift to having their births at younger ages, as they did during the post-war baby-boom years, TFR rises because births are brought forward in time. Likewise, the 2004–05 policy package induced women across a wide range of ages to have their next birth somewhat earlier than otherwise would have been the case, and TFR rose to its highest level for 30 years.
Once a shift of births to younger ages ceases, the TFR can be expected to fall because many women have already had their births at a younger age. This partly explains the fall in TFR from 2012–13 onwards. However, it is also evident that there is a strong, new trend for younger women to delay their first births more than they have ever done in the past. As evidence of this new trend, 86% of the fall in TFR from 2006–07 to 2018–19 occurred at ages 15–30, the younger ages. The sharpest decline was for teenagers (aged 15–19) for whom the fertility rate halved over these years.
There are several possible explanations for younger women increasingly delaying their births. First, women are remaining longer in education. In 2010, 72% of girls aged 15–19 were in full-time education. This had increased to 82% by 2020. A longer period in education then leads to delay of job commencement and career advancement, slower income growth, delay of couple formation and delay of home purchase, all of which contribute to delay of the first birth. Of course, their potential partners experience the same delays. Second, in the past, some teenage girls who had little prospect of advancement in their lives had a baby to give their life greater meaning. Potentially, this attitude has waned in recent years with teenage childbearing now being considered an unwise approach to life. Third, and associated with the previous two possibilities, younger women may have become more effective users of contraception. Fourth, the 2009 Global Financial Crisis (GFC) may have induced a greater sense of caution among both young men and young women and it is possible that young men are also actively avoiding the prospect of early fatherhood. The GFC may also have changed hiring practices so that jobs for young people became less secure in their tenure.
Since the 1970s, except for the five years following the 2004–05 policy package, births have been occurring at older and older ages every year. Conventionally, births were delayed by women up to about age 30 on average but made up (recuperated) from age 31 onwards. This pattern of behaviour led to continuing increases in fertility rates among women aged over 30 (see Figure 2). However, following the peaks related to the 2004–05 policy package, fertility rates above age 30 flattened out initially because, as explained above, many women had had their births at earlier ages immediately following the introduction of the package. However, in the past five years, a very new trend has emerged for women in their 30s. Birth rates between ages 31 and 40 have been falling for the first time in 50 years (Figure 2).
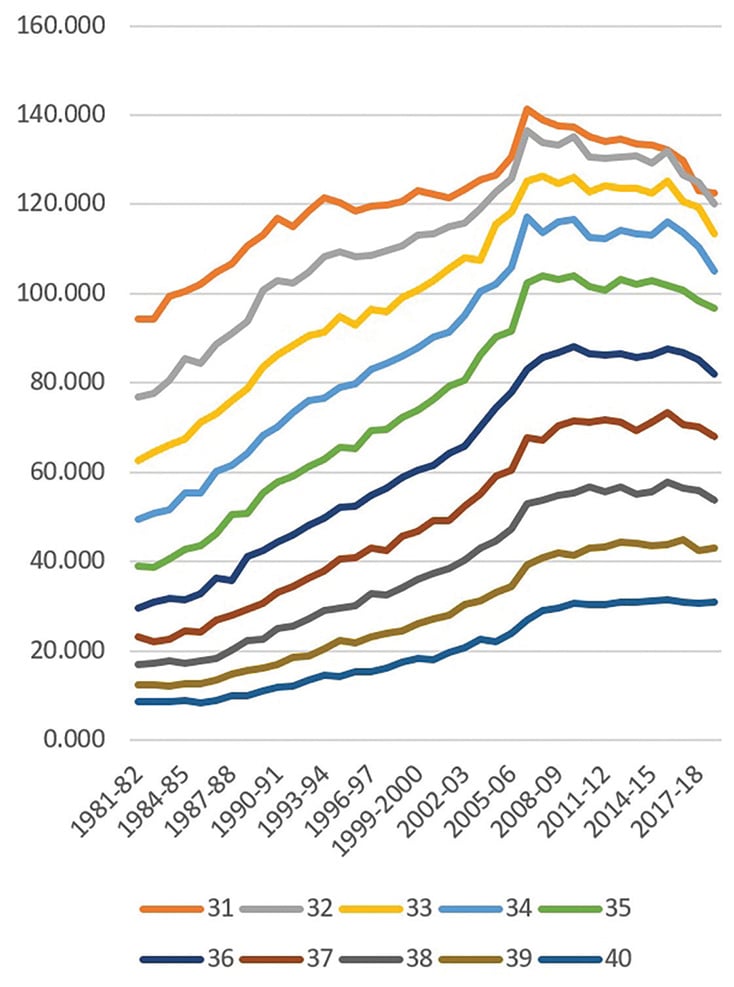
Figure 2. Fertility rates, ages 30–40, 1981–82 to 2017–18.
Thus, in the past five years, fertility rates have been falling at all ages from 15 to 40, explaining the very low values for TFR in these years. Rates above age 40 have not fallen but the previous, long-term rising trend at these ages has ended. And, only 3% of total fertility occurs from age 41 onwards. It is interesting that these trends for Australian women are mirrored by similar trends in other English-speaking countries and in the Nordic countries. In New Zealand, TFR fell from 2.10 in 2012 to 1.72 in 2019; in Finland, from 1.80 in 2012 to 1.35 in 2019.
While it can be expected that the fall in fertility among women in their thirties will slow down or even reverse in the future as the cohorts in their twenties (who have been delaying births) move into their thirties, the declines that have occurred in the past few years for women in their thirties are a very strong indication that TFR will remain low. We are observing a new social trend.
What explains the new and recent behaviour of women in their thirties? This is not an easy question to answer. An obvious point to be made is that, when births are delayed to older and older ages, many of the delayed births never occur. This is because the physiological capacity to reproduce falls away with increasing age but, even more, this occurs because women and their partners reach a stage where they consider that a child or an additional child will be too much of a disruption to their evolving, more settled lives (careers, incomes, lifestyles, relationships). In this situation, the family of three children or more starts to fall away in its frequency, and, in the past 40 years, third or subsequent births have maintained the Australian TFR at a relatively high level of around 1.8 to 2.0 births per woman. Furthermore, one and no child families become more common as first births are delayed by some women to very late ages.
The use of artificial reproductive technologies (ART) can assist those who are eager to have a child but face physiological challenges but ART births constitute only about 5% of births in Australia and, as births are delayed to older and older ages, the technologies become less effective.
For the 70–80%of women who have good or reasonable employment prospects, fertility is enhanced through policies that support the combination of work and family, particularly access to affordable childcare. While Australia introduced a government-funded paid parental leave system in 2011, international evidence suggests that such leave does not have much effect on the number of births that women have, although, in some situations like Sweden for example, changes in the parental leave system affected the timing of births. The employment participation of mothers does not remain static across time but there is a strong tendency for government support for the combination of work and family to remain static and thereby fall behind changing social behaviour. In Australia, for example, 59 percent of couple families with a child aged 0–4 years in 2019 had both parents employed compared with 48% in 2009. There are benefits, both social and political, in providing enhanced access to childcare.
For the 20–30% of women who do not have post-school qualifications and therefore poor employment prospects, the benefits received from government have fallen considerably since paid parental leave was introduced. From the perspective of the child, the Australian family benefits system is now extremely regressive with poorer children being in families that qualify for little support compared with two-income families that draw large benefits from the childcare and parental leave systems. This is because the larger government benefits related to children (paid parental leave and childcare subsidies) are now highly contingent upon workforce participation. There is still a baby bonus payment for non-working parents, but its value is very small now compared with the time that paid parental leave was introduced. And those not working are only entitled to a maximum of 20 hours per week of childcare support compared with 40 hours for a working parent. The FTB Part A Supplement designed for poorer families is now just $15 per week per child and is only obtainable after the end of the financial year. In the interests of equity for the children in these families, attention needs to be given to increases in FTB Part A and to longer hours of childcare for children in poorer families.


Leave a Reply